INFLUENCE OF TROPICAL STORMS
ON TURBIDITY IN CHESAPEAKE BAY, USA
Cortney Cameron
EOS 321S, Duke University – Durham, NC
Introduction
The Chesapeake Bay, located in the mid-Atlantic costal region of Maryland and Virginia, is a partially mixed estuary and the largest in the United States, with a length of 300 km and area of 6,500 km2 [Willard et al., 2003]. With an average depth of 6.5 m, the Bay is broad and shallow, cut by a 20-30 m deep by 1-4 km wide central channel; depths greater than 10 m constitute just 24% of the Bay’s surface area [Kemp et al., 2005]. The Bay is interconnected with its 165,000 km2 watershed by a 18,000 km dendritic shoreline [Kemp et al., 2005; Willard et al., 2003] and exhibits a strong north-south salinity gradient; fluvial freshwater drives stratification, overlying denser seawater from the Atlantic Ocean to the south and driving stratification, which suppresses vertical exchange and traps sediments [Sanford, Suttles, & Halka, 2001]. Episodic storm events serve to destratify Bay waters and stir sediments, playing key roles in both erosion and deposition, depending on storm dynamics [Stevenson, Kearney, & Pendleton, 1985; Kemp et al., 2005; Palinkas et al., 2013].
Once one of the most productive estuaries in the world, the Bay has suffered from anthropogenic eutrophication and concomitant severe hypoxia since the 1950s and 1960s [Kemp et al., 2005]. Sea level rise and erosion have resulted in the reduction of marshes and islands, which serve as sediment reservoirs and provide nesting sites for endangered waterbird populations and other valuable species [Erwin et al., 2010; Stevenson, Kearney, & Pendleton, 1985]. Understanding sediment transport in the Bay could aid in modeling marsh accretion and help inform land management and conservation plans.
As characterized by salinity, depth, and slope (all increasing from north to south), The Bay is divided into three sections—Upper, Middle, and Lower—which also exhibit some sediment differences [Kemp et al., 2005]. This paper will focus on sediment transport in the northern part of the Bay. Suspended sediments there consist of silts and clays, sourced primarily from river discharge and shoreline erosion, although phytoplankton production plays a significant role in the Middle Bay [Biggs, 1969; Sanford, Suttles, & Halka, 2001].
Turbidity, a measure of water clarity, can be used to estimate total suspended solids (TSS) provided frequent calibration, and from there, total sediment transport can be estimated [Sanford, 1994; Lewis, 1996; Sanford, Suttles, & Halka, 2001]. Elevated turbidity levels are associated with increased sediment transport in the Bay [Sanford, 1994] and can negatively impact oyster reefs and primary productivity [Kemp et al., 2005]. Turbidity is measured through optical backscatter of particles in the water column; common units include Formazin Turbidity Units (FTU) and Nephelometric Turbidity Units (NTU), which are equivalent and are named for the compound used during instrument calibration [Wilde & Gibs, 1998]. The turbidity-TSS relationship typically consists of a two-part line, with the slope much lower at lower turbidity and then breaking into a steeper slope at higher turbidity, consistent with the differential mobilization and settling of fine versus coarse particles [Sanford, 1994; Lewis, 1996; Sanford, Suttles, & Halka, 2001].
The Susquehanna River at the Bay’s northern end provides 48% of total riverine discharge for the entire Bay and provides 60% of the sediment flux in the northern Bay [Willard et al., 2003; Kemp et al., 2005]. The work of Gross et al. [1978] found a linear correlation between suspended sediment concentrations and the discharge of the Susquehanna River, estimating that the river delivered 50 million metric tons to the northern Bay between 1966 and 1976, with 80% of total transport occurring during two hurricane flood events, underscoring the importance of storms for sediment mobilization. Likewise, the work of Palinkas et al. [2013], utilizing rapid-response coring cruises following two tropical storms in 2011, measured up to 4 cm of flood sediment deposition in the upper Bay from Tropical Storm Lee.
Sanford [1994] used moored instruments in shallow (3.5 and 5.5 m) upper Bay waters to look at how TSS varied with factors such as wind speed and discharge of the Susquehanna River; he concluded that wind-wave forcing played the greatest role in sediment suspension, with an effect 3-5 times larger than tidal processes. In this study, I will explore the relationship between turbidity (as proxy for TSS) and tropical storms in the northern Bay by looking at known storm dates and by using increased wind speed, wave height, salinity, Susquehanna River discharge, and precipitation values as indicators of increased storm activity.
Methods
Wind speed, wave height, salinity, and turbidity measurements for July 1, 2012 to December 31, 2013 were obtained from National Oceanic and Atmospheric Administration (NOAA) National Data Buoy Center (NDBC) Station 44062 (Fig. 1), a moored buoy located at Gooses Reef, Maryland (38°33’23”N 76°24’53”W). Wind speed, wave height, and salinity are measured every ten minutes, while turbidity is measured hourly. It is not disclosed at what depth the buoy measures salinity and turbidity, but sea temperature is measured at 0.5 m below site elevation. The buoy is located near the Bay’s central channel, where depths range between 20 and 30 meters (NOAA Nautical Chart 12266).
Daily mean precipitation data was obtained from NOAA’s National Climatic Data Center Station US1MDTB0011, located in Easton, Maryland (38°47’ 4”N 76°4’26”W), approximately 38 km northeast of the buoy. Daily mean discharge for the Susquehanna River—the only major river draining into the Bay north of the buoy—was obtained for the same time period from U. S. Geological Survey Station 01578310, located at the Conowingo Dam in Maryland (39°39’28”N 76°10’28”W), approximately 15 km north of the river’s mouth (Fig. 1).
All buoy data was averaged by day, and then a daily time series was constructed using wind speed, salinity, discharge, precipitation, and turbidity. Means, medians, ranges, and standard deviations were obtained from this series. Regression lines were calculated to examine the relationship between turbidity and the following: wind speed, salinity, discharge, and precipitation. A regression line was also calculated for wind speed versus wave height.
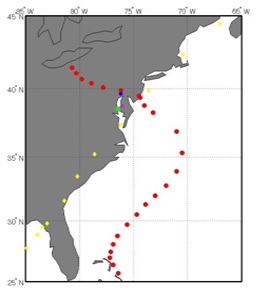 Figure 1. Map showing location of buoy (green dot), river gauge (blue dot), rain gauge (pink dot) and tracks for Hurricane Sandy (red dots) and Tropical Storm Andreas (yellow dots). Track data: National Weather Service (http://nhc.noaa.gov/data).
Results
Increased turbidity values were found to correlate temporally with tropical storm events based on visual observation (Fig. 2), but typical storm indicators (Fig. 3). Precipitation showed the strongest correlation with turbidity, with a time lag between precipitation onset and turbidity spikes, but the direct relationship was weak (y = 0.0041x + 1.472, r2 = 4.7418 x 10⁻⁴). Wind speed exhibited high day-to-day variability (mean 5.2 m/s, standard deviation 1.9 m/s) and did not correlate strongly with turbidity (y = 0.0257x – 1.3283, r2 = 0.0025); maximum wind speed (14.2 m/s) occurred during Hurricane Sandy (October 29, 2012) following an initial drop, but this drop-rise relationship was not noticeable for the other large storm events. Wave height was found to correlate strongly with wind speed (y = 0.0820x – 0.0656, r2 = 0.8617) and so was excluded from further analysis. Salinity averaged at 13.3 ppt, with maximum salinity (18.1 ppt) observed on October 29, 2012 during a period of somewhat elevated turbidity (8 FTU); salinity did not correlate strongly with turbidity (y = 0.0069x + 1.3680, r2 = 7.5157 x 10⁻⁴). Discharge showed high day-to-day variability (standard deviation 704 m3/s, range 5,333 m3/s) and did not correlate strongly with turbidity (y = -0.0046x + 14.4906, r2 = 0.0152). Statistical results are summarized in Table 1.
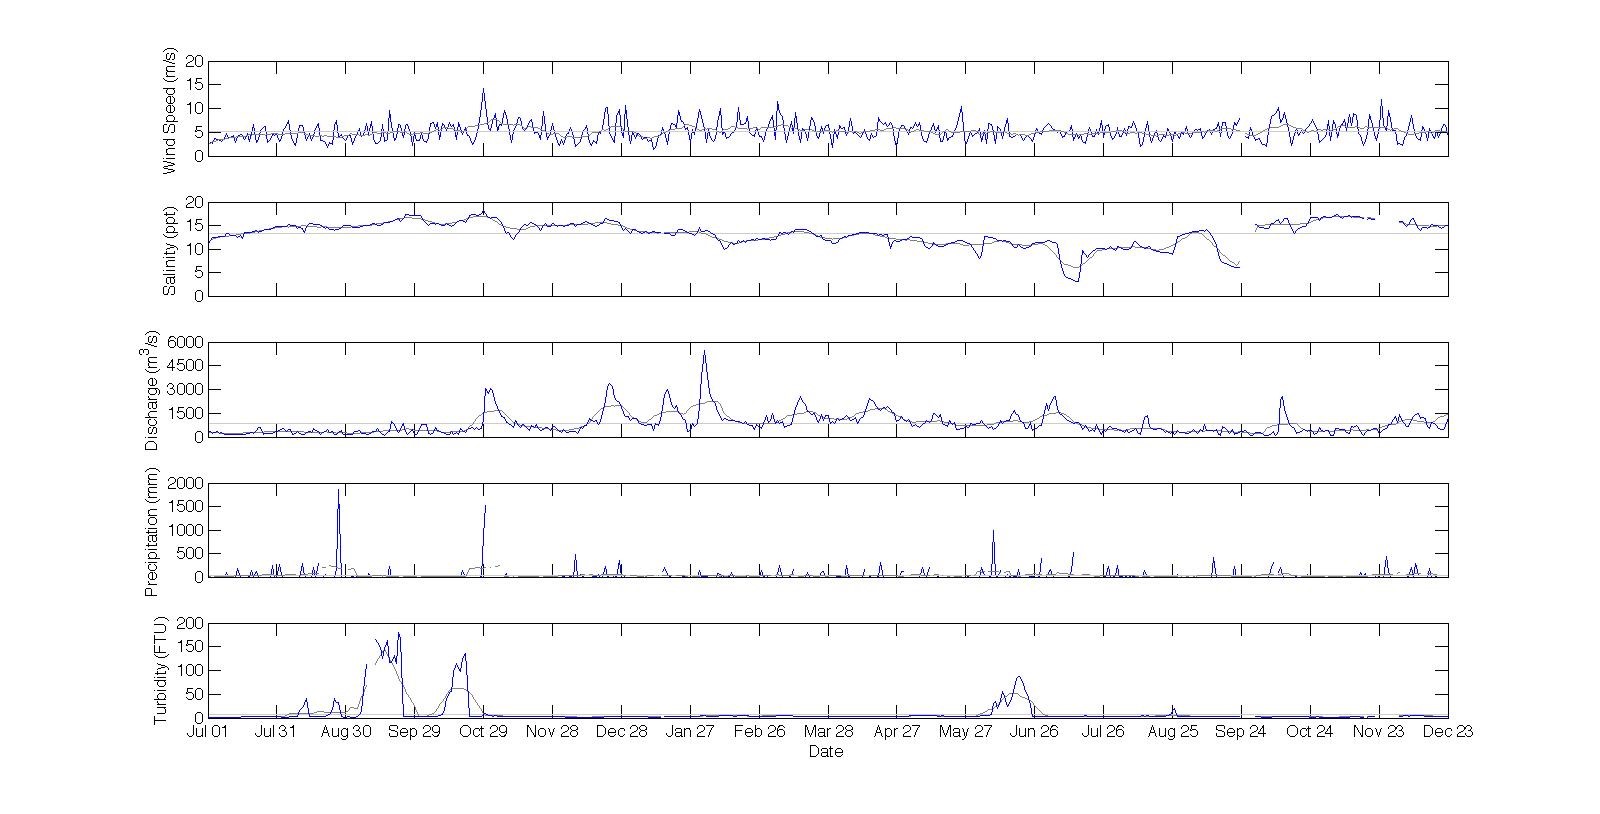 Figure 2. Time series, from top to bottom, for wind speed (m/s), salinity (ppt), discharge (m3/s), precipitation (mm), and turbidity (FTU), from July 1, 2012 to December 31, 2013. Light grey line represents average; dark grey line represents 7-day moving average. Large storm events (highlighted in red boxes) occurred during September 2012, October 22-31, 2012 (Hurricane Sandy), and June 5-10, 2013 (Tropical Storm Andreas).
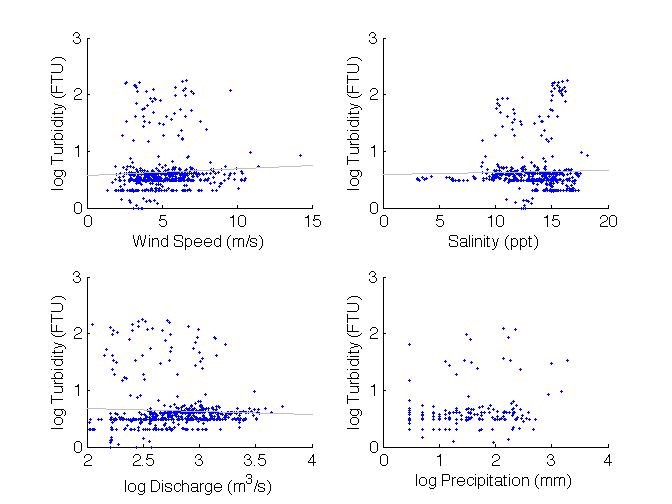
Figure 3. Scatter plots, counterclockwise from top left, of turbidity as a function of wind speed (m/s), salinity (ppt), discharge (m3/s), and precipitation (mm) in northern Chesapeake Bay from July 1, 2012 and December 31, 2013. Regression lines were as follows: wind speed: y = 0.0257x – 1.3283, r2 = 0.0025; salinity: y = 0.0069x + 1.3680, r2 = 7.5157 x 10⁻⁴; discharge: y = -0.0046x + 14.4906, r2 = 0.0152; precipitation (not shown): y = 0.0041x + 1.472, r2 = 4.7418 x 10⁻⁴.
| Table 1. Mean, median, standard deviation, maximum, minimum, and range for turbidity (FTU), wind speed (m/s), wave height (m/s), salinity (ppt), discharge (m3/s), and precipitation (mm) in northern Chesapeake Bay from July 1, 2012 to December 31, 2013. | ||||||
| Mean | Median | St Dev | Max | Min | Range | |
| Turbidity (FTU) | 10 | 3 | 27 | 179 | 1 | 178 |
| Wind Speed (m/s) | 5.1539 | 4.8607 | 1.8846 | 14.2112 | 1.3741 | 12.8371 |
| Wave Height (m) | 0.3536 | 0.3254 | 0.1641 | 1.3625 | 0.595 | 1.3030 |
| Salinity (ppt) | 13.3020 | 13.6174 | 2.5965 | 18.1583 | 3.0333 | 15.1250 |
| Precipitation (mm) | 40 | 0 | 142 | 1,872 | 0 | 1,872 |
| Discharge (m3/s) | 835 | 620 | 704 | 5,437 | 104 | 5,333 |
Discussion
While turbidity did exhibit large spikes during the arrival of the two tropical cyclone events, turbidity did not show a direct correlation with wind speed, salinity, discharge, or precipitation. As the time series does suggest that large precipitation events directly precede turbidity spikes (Fig. 2), additional statistical analyses are needed to explore this relationship, which is unlikely to be linear. Test runs with time lags between 1 and 7 days did not significantly improve the relationship, with r2 values ranging between 1.9x10⁻⁵ (1 day) and 1.5x10⁻⁴ (3 days), compared to the original value of 4.0x10⁻⁴. It is suspected that looking at the area under the curve would provide further insights into the precipitation-turbidity relationship, given the large turbidity increase following comparatively moderate but sustained precipitation during Hurricane Sandy.
For discharge, the weak correlation could be explained by the presence of dams, including one 15 km north of the Bay, along the Susquehanna River, as dams tend to trap river sediments [Colman & Bratton, 2003; Kummu & Varis, 2007]. However, the work of Sanford [1994] found that increased discharge from the Susquehanna River resulted in increased TSS, although his study sites were located closer to the river’s mouth and in shallower waters. Sanford estimated that similar processes affecting sediment transport in the northernmost part of the Bay would extend to most of the Bay, but his argument was based on a Bay average depth of 8.5 m.
As such, an important compounding factor in this study is the location of the buoy in the central channel, as greater depths there cushion the benthos from shear stress induced by surface waves. By comparing turbidity in different parts of the Bay as well as in other regions, further studies could attempt to tease out the impact that geomorphology (such as depth and basin shape) has on turbidity. Furthermore, freshwater-driven stratification can also trap sediments at depth by suppressing vertical exchange [Sanford, Suttles, & Halka, 2001], and although strong wind events are known to de-stratify Bay waters for short periods of time [Kemp et al., 2005], the largest turbidity values in this study occurred during periods of low wind speeds. However, it is unlikely that even the strongest winds encountered in this study would mix the full 20-30 m depth of the central channel.
Another consideration is that the tropical storms did not pass directly over the Chesapeake Bay (Fig. 1). The distance of the storm centers from the Bay might have dampened the storm’s effect, or at least caused a time lag that complicated a direct correlation between turbidity and other values; the distance could also explain why storms were not associated with markedly increased wind activity (Fig. 2). Although both storms were similarly distant from the buoy, the Bay exhibited greater turbidity increases during Hurricane Sandy than it did during Tropical Storm Andreas; this could be explained by 1) Andreas traveled south of the buoy while Sandy traveled north of it, which would have increased runoff to the buoy, and 2) greater precipitation was associated with Hurricane Sandy. Indeed, the highest turbidity value (179 FTU) was in associated with the greatest precipitation value (1,872 mm), which occurred during a sustained thunderstorm event in September 2012. Future research could examine the relative importance of storm distance, storm intensity, and storm duration to turbidity.
Additionally, it is likely that the variables considered in this study do not capture all of the phenomena that could influence turbidity, such as current velocities, and stratification; future research should include these factors. In this vein, longer time series are needed in order to thoroughly investigate the response of turbidity to storm events, as this paper covered only 1.5 years of data (note that the buoy did not begin collecting turbidity data until July 1, 2012). As previously mentioned, elevated turbidity levels hamper productivity in the Bay by reducing light availability to phytoplankton and smothering oyster reefs, and are also proxy for increased sediment transport; this transport, depending on storm dynamics, can result in net deposition or removal. With hurricanes are expected to intensify due to climate change [Emmanuel, 2005; Knutson, 2010], understanding the turbidity-storm relationship could become crucial in protecting Bay habitats, particularly in addressing anthropogenic contributions to turbidity, such as fertilizer run-off [Kemp et al., 2005].
However, despite the potential, few buoys listed in the NOAA NDBC measure turbidity. Of 292 buoys checked, only 5 buoys offer this capability, all located in the Chesapeake Bay, where monitoring turbidity is important due to freshwater-saltwater mixing; yet, surprisingly, none of the buoys checked in the Florida Bay (17)—also an estuarine environment—measured turbidity. Given the relative ease of measuring turbidity and the potential for turbidity to be converted into TSS after calibration, coastal monitoring stations lacking this feature represent missed opportunities to better understand sediment movement in coastal regions.
In conclusion, this study shows that while tropical storm events do correlate temporarily with increased turbidity, sediment transport in the Chesapeake Bay is a complex process that cannot be satisfactorily explained by simple linear regressions; further research is needed to describe and quantify estuarine sediment circulation resulting from tropical storms impacting the Bay.
References
Biggs, R. B. (1970), Sources and distribution of suspended sediment in northern Chesapeake Bay, Marine Geology, 9(3), 187-201.
Colman, S. M., & Bratton, J. F. (2003), Anthropogenically induced changes in sediment and biogenic silica fluxes in Chesapeake Bay, Geology, 31(1), 71-74.
Emanuel, K. (2005), Increasing destructiveness of tropical cyclones over the past 30 years, Nature, 436(7051), 686-688.
Erwin, R. M., Brinker, D. F., Watts, B. D., Costanzo, G. R., & Morton, D. D. (2011), Islands at bay: rising seas, eroding islands, and waterbird habitat loss in Chesapeake Bay (USA), Journal of Coastal Conservation, 15(1), 51-60.
Gross, M. G., Karweit, M., Cronin, W. B., & Schubel, J. R. (1978), Suspended sediment discharge of the Susquehanna River to northern Chesapeake Bay, 1966 to 1976, Estuaries, 1(2), 106-110.
Kemp, W. M., Boynton, W. R., Adolf, J. E., Boesch, D. F., Boicourt, W. C., Brush, G., Cornwell, J. C., Fisher, T. R., Glibert, P. M., Hagy, J. D., Harding, L. W., Houde, E. D., Kimmel, D. G., Miller, W. D., Newell, R. I. E., Roman, M. R., Smith, E. M., & Stevenson, J. C. (2005), Eutrophication of Chesapeake Bay: historical trends and ecological interactions, Marine Ecology Progress Series, 303(21), 1-29.
Knutson, T. R., McBride, J. L., Chan, J., Emanuel, K., Holland, G., Landsea, C., Held, I., Kossin, J. P., Srivastava, A. K., and Sugi, M. (2010), Tropical cyclones and climate change, Nature Geoscience, 3(3), 157-163.
Kummu, M., & Varis, O. (2007), Sediment-related impacts due to upstream reservoir trapping, the Lower Mekong River, Geomorphology, 85(3), 275-293.
Lewis, J. (1996), Turbidity‐controlled suspended sediment sampling for runoff‐event load estimation, Water Resources Research, 32(7), 2299-2310.
Miles, T., Glenn, S. M., & Schofield, O. (2013), Temporal and spatial variability in fall storm induced sediment resuspension on the Mid-Atlantic Bight, Continental Shelf Research, 63, S36-S49.
Palinkas, C. M., Halka, J. P., Li, M., Sanford, L. P., & Cheng, P. (2013), Sediment deposition from tropical storms in the upper Chesapeake Bay: Field observations and model simulations, Continental Shelf Research.
Sanford, L. P., Suttles, S. E., & Halka, J. P. (2001), Reconsidering the physics of the Chesapeake Bay estuarine turbidity maximum, Estuaries, 24(5), 655-669.
Stevenson, J. C. M. S., Kearney, M. S., & Pendleton, E. C. (1985), Sedimentation and erosion in a Chesapeake Bay brackish marsh system, Marine Geology, 67(3), 213-235.
Wilde, F. D., & Gibs, J. (1998), Section 6.7: Turbidity, National Field Manual for the Collection of Water-Quality Data: U.S. Geological Survey Techniques of Water-Resources Investigations, Book 9, United States Geological Survey, Reston, VA, USA.
Willard, D. A., Cronin, T. M., & Verardo, S. (2003), Late-Holocene climate and ecosystem history from Chesapeake Bay sediment cores, USA, The Holocene, 13(2), 201-214.