Milankovitch cycles essentially describe earth's relationship with the sun based on eccentricity, obliquity, and precession. Each of these three components operates on a different timescale, but when they overlap in just the right way, they can reduce insolation (the sunlight hitting the earth) and lower temperatures; conversely, when they work to increase insolation, temperatures go up. For more information on how these cycles influence climate, visit NASA, Skeptical Science, or Wikipedia.
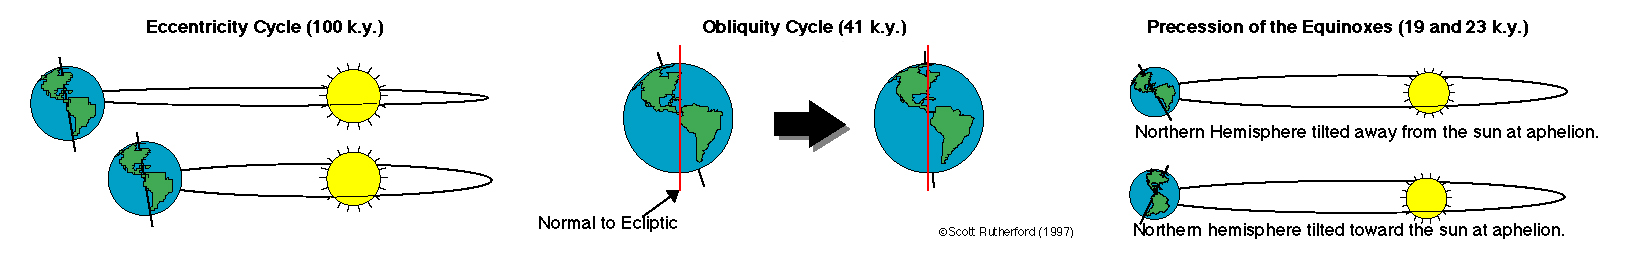
Image credit: Scott Rutherford
| Eccentricity: The earth's orbit is an ellipse (an oval); eccentricity measures exactly how much the earth's orbit deviates from a circle. The more elliptical (eccentric) the orbit, the farther the earth will travel away from the sun, and the less sunlight it receives. Every 100,000 years or so, the earth's eccentricity varies between -0.03 and +0.02, currently standing at 0.017. The eccentricity varies because of gravitational interactions with other planets. |  |
| Obliquity: Today, the earth's axis of rotation is tilted at about 23.5° with respect to the sun, but every 41,000 years it spans travels between 22.1° and 24.5°. At higher angles, the seasons become more exaggerated; the earth receives more sunlight during summer, and less during winter. | 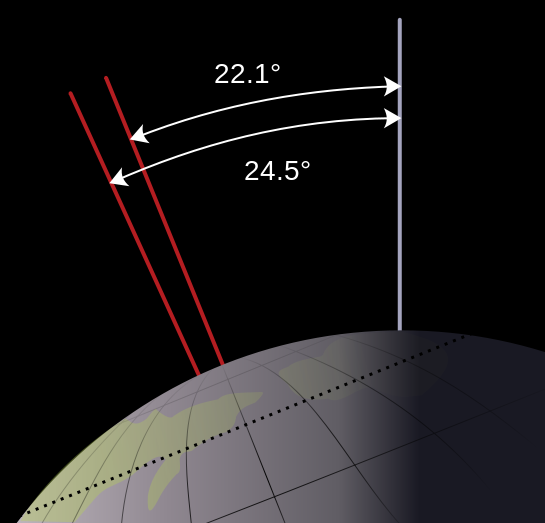 |
| Precession: If obliquity is the angle of earth's axis of rotation, precession can be thought of as the direction of that axis. Imagine a top spinning and leaning in different directions as it wobbles. The earth's axis of rotation completes a full circle every 23,000 years. When the axis points toward the sun, the northern hemisphere receives more sunlight; when it points way, the southern hemisphere receives more sunlight. | 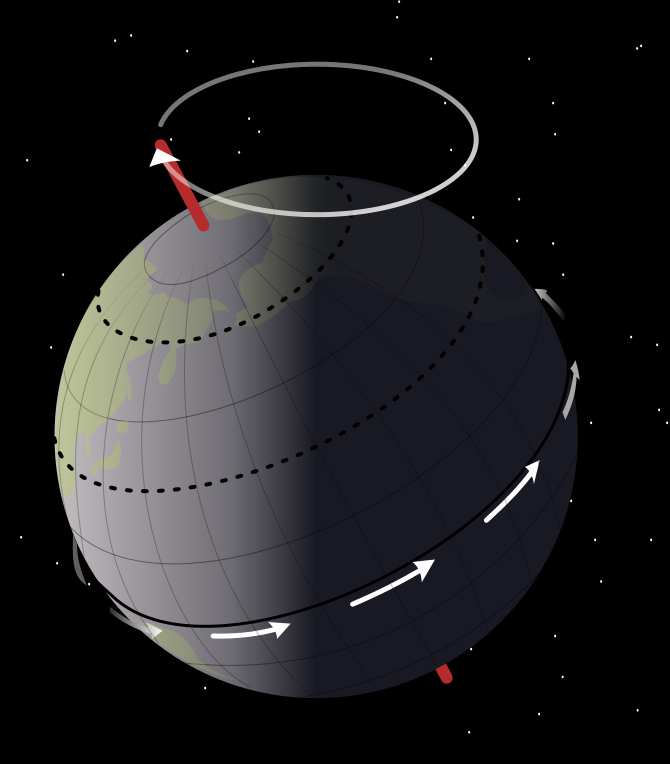 |
Scientists can calculate future and past eccentricity, obliquity, and precession and construct graphs such as the one below. Past temperatures can be reconstructed using sediment cores and ice cores; that data can then be compared to the Milankovitch cycles. I've highlighted one section from in the following graph that shows the correlation between a temperature peak and peaks in the Milankovitch cycle (read the caption for more information). This graph only shows one thousand years of data, but similar graphs have been made reaching back hundreds of thousands of years, also revealing periodic rising and falling of temperatures.
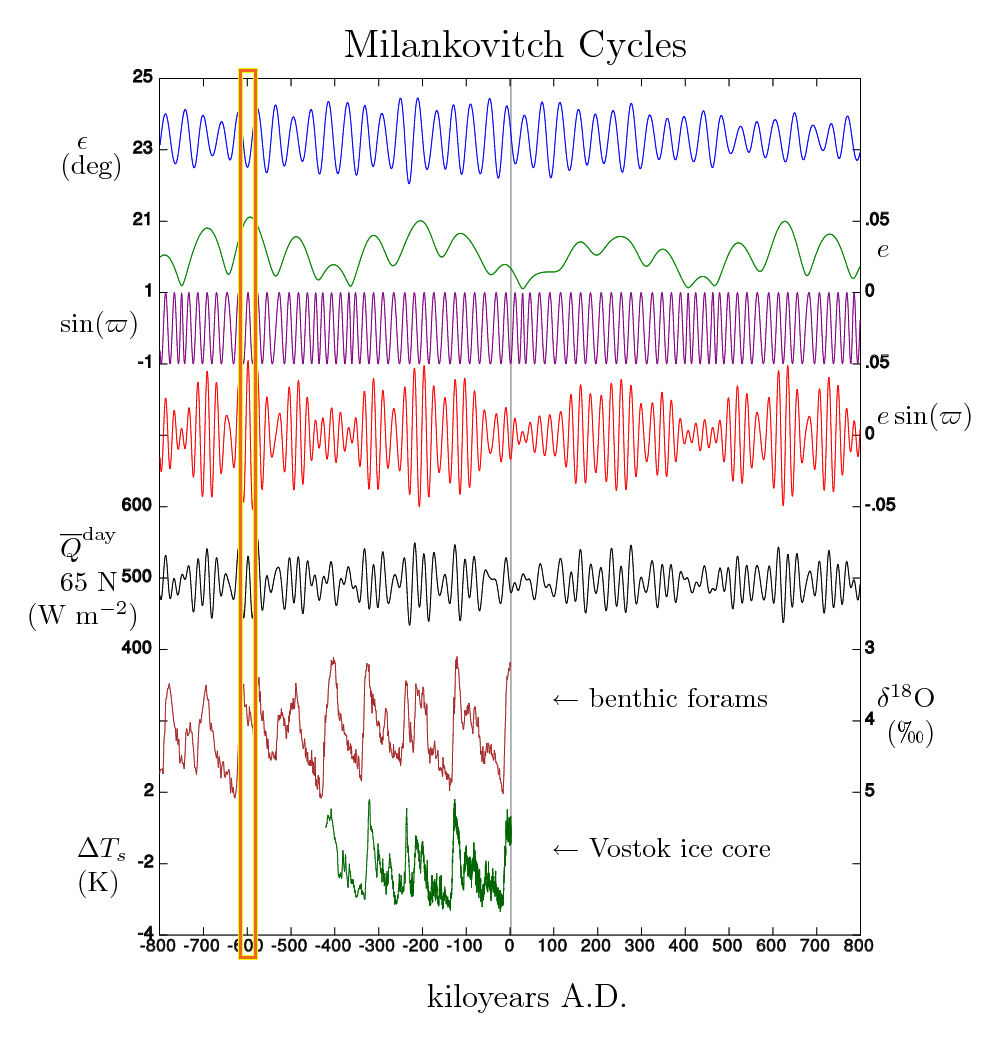
Past and future Milankovitch cycles. ε is obliquity (axial tilt). e is eccentricity. ϖ is longitude of perihelion. e sin(ϖ) is the precession index, which together with obliquity, controls the seasonal cycle of insolation. Q is the calculated daily-averaged insolation at the top of the atmosphere, on the day of the summer solstice at 65 N latitude. Benthic forams and Vostok ice core show two distinct proxies for past global sealevel and temperature, from ocean sediment and Antarctic ice respectively. The vertical gray line shows current conditions, at 2 ky A.D. Image credit: Incredio, en.wikipedia.org.
Short-Term and Long-Term Climate Variability
At hundreds of thousands of years, Milankovitch cycles are considered to affect climate on the short-term. Other short-term influences include changes in albedo and solar output. Long-term influences on climate, such as atmospheric chemistry or the positioning of the continents, operate on the order of tens of millions of years or more.